Introducing: Performance Tracker
You can read every ownership breakdown and captain guide ever written and still not know the one thing that decides whether any of it worked: are you actually a winning player, and in which contests?
Most people answer that from memory, and memory flatters. You remember the Sunday you took down a single-entry GPP. You forget the forty double-ups that leaked out over three months. The only honest answer is the one you get from adding it all up, and almost nobody does.
That is what the Performance page is for.
What it does
Upload your DraftKings contest-history CSV, the one DK exports straight from your account, and Pylon turns it into a scoreboard for your own play. It reads every entry in the file and shows you the totals: entries, contests, buy-in, cash winnings, net, ROI, cash rate.
It runs entirely in your browser. Nothing is sent to a server, nothing is stored anywhere but your own machine. Close the tab and the data is gone until you upload it again.
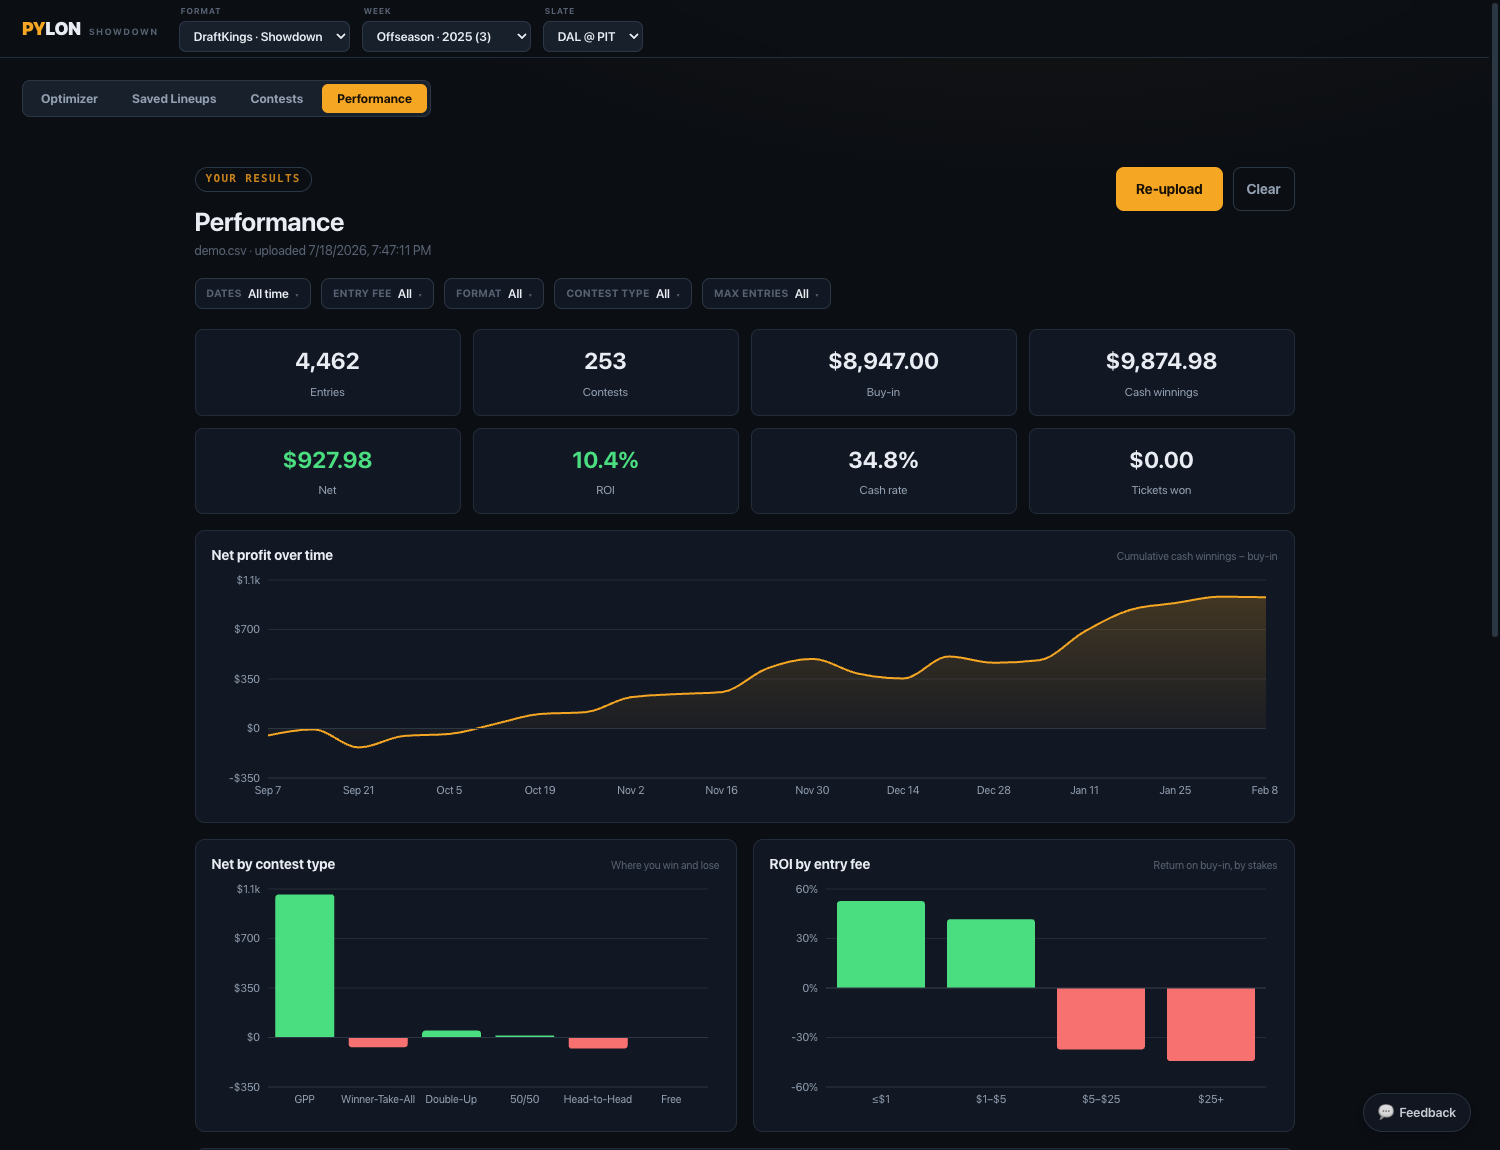
It also charts your bankroll across the whole season, so you see the shape and not just the endpoint. A year that finishes up could have been a steady climb or a white-knuckle round trip, and those are two very different players with the same final number.
Then it lets you cut the data. Filter by date, by entry fee, by format (Showdown or Classic), by contest type (GPP, double-up, 50/50, head-to-head, and so on), and by the contest's entry cap, single-entry versus 20-max versus 150-max. Every tile and every chart recomputes to whatever you have selected. Pick more than one value in a filter and a table breaks the results out by each one, side by side, so you can compare them directly. There is a table of your biggest single cashes too, for the current filter.
Why it matters
Strategy content teaches general edges. Fade the chalk captain, get your bring-back, do not pay up at kicker. All useful, all general. What an article cannot tell you is that you crush low-stakes GPPs and hand it all back the moment you touch a $25 single-game. Only your own results know that, and only if you look at them broken down finely enough to see it.
Aggregate numbers hide leaks. A player can be green overall and still be lighting money on fire in one format, quietly carried by another. Break it out by stakes and contest type and the picture turns specific. You find the pools you genuinely beat, and the ones you should stop entering. That is the difference between a hunch about where you are good and a number you can act on.
Contest selection moves your bankroll more than any single lineup does. This is how you find out which contests deserve your money, using your results instead of your gut.
One caveat
A few hundred entries is not a verdict. DFS variance is large, and a hot or cold stretch will swamp your real edge over any small sample. Read a green season as encouraging, not as proof, and trust the breakdowns that have real volume behind them over the ones built on a handful of contests. The tool will not make you a winner. It will tell you the truth about where you stand right now, broken down clearly enough to do something about, which is more than most players ever bother to learn.
Upload your history and take a look. It is free, it stays on your machine, and it might change where your money goes next week.